Fiber population analysis
The Number of Fiber Orientation (NuFO) map is estimated from the number of local maxima of the fODF profile in each voxel. The intensity of each voxel corresponds to the number of fiber populations, ranging from 1 for the single fiber population to 2 and more for the multiple fiber populations.
NuFO averaged map, range scale [0 (blue) - 3.4 (red)].
We apply two thresholds of 1 and ≥2 on the NuFO map to compartmentalize the “average” bundle (i.e., whole bundle) into “single” and “multi” fiber populations compartments, respectively. For this, each voxel of the whole and section masks for each bundle is sorted according to these two thresholds using SCIL scripts.
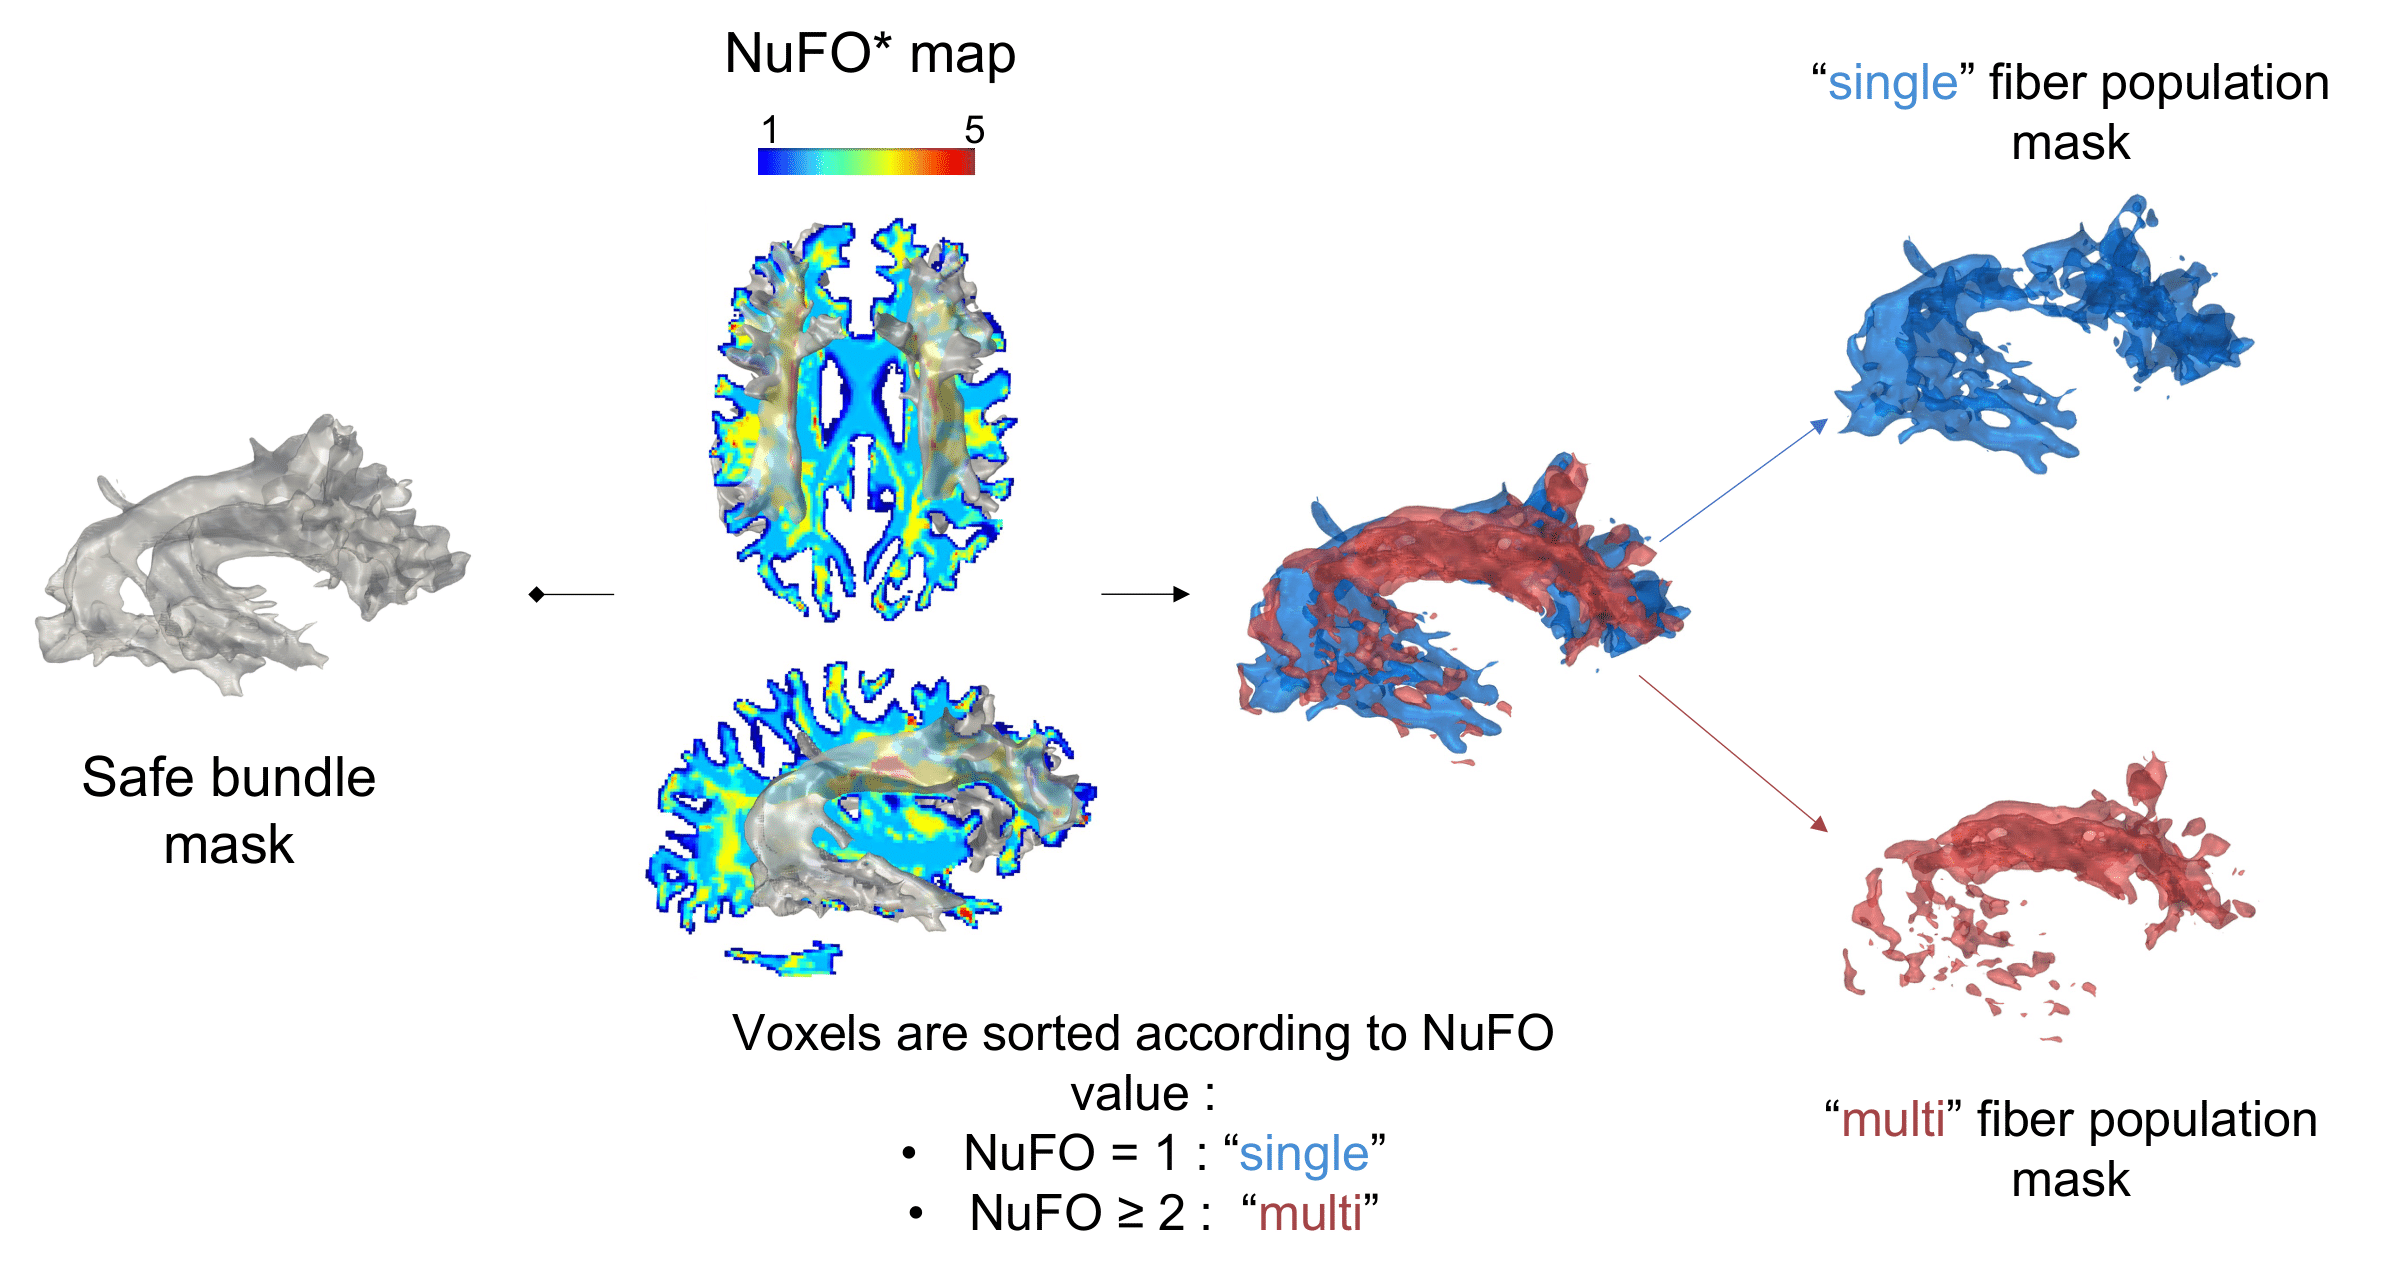
Pipeline to generate single and multi-fiber masks to analyze the impact of fiber population on consistency.
See section Impact of fiber population: measures for measures distribution according to number of fiber population.
See section Impact of fiber population: consistency for consistency according to number of fiber population.